Color Maps
A color map defines a relationship between scalar data values and a range of colors. Color maps are commonly used to generate false color images, color scatter-plot points, and illustrate the height of surface plots.
PyQtGraph’s ColorMap can conveniently be applied to images and interactively
adjusted by using ColorBarItem.
To provide interactively user-defined color mappings, see
GradientEditorItem and GradientWidget, which wraps it.
GradientEditorItem combines the editing with a histogram and controls for
interactively adjusting image levels.
ColorMap can also be used a convenient source of colors from a consistent palette or to generate QPen and QBrush objects used to draw lines and fills that are colored according to their values along the horizontal or vertical axis.
Sources for color maps
Color maps can be user defined by assigning a number of stops over the range of 0 to 1. A color is given for each stop, and the in-between values are generated by interpolation.
When map colors directly represent values, an improperly designed map can obscure detail over
certain ranges of values, while creating false detail in others. PyQtGraph includes the
perceptually uniform color maps provided by the
Colorcet project. Color maps can also be imported from the
colorcet library or from matplotlib, if either of these is installed.
To see all available color maps, please run the ColorMap demonstration available in the suite of Examples.
Examples
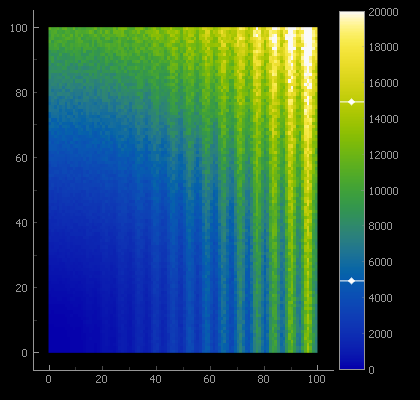
False color display of a 2D data set. Display levels are controlled by
a ColorBarItem:
# prepare demonstration data:
data = np.fromfunction(lambda i, j: (1+0.3*np.sin(i)) * (i)**2 + (j)**2, (100, 100))
noisy_data = data * (1 + 0.2 * np.random.random(data.shape) )

# Example: False color image with interactive level adjustment
img = pg.ImageItem(image=noisy_data) # create monochrome image from demonstration data
plot.addItem( img )            # add to PlotItem 'plot'
cm = pg.colormap.get('CET-L9') # prepare a linear color map
bar = pg.ColorBarItem( values= (0, 20_000), cmap=cm ) # prepare interactive color bar
# Have ColorBarItem control colors of img and appear in 'plot':
bar.setImageItem( img, insert_in=plot )
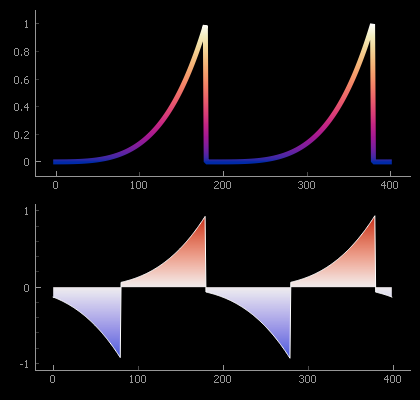
Using QtGui.QPen and QtGui.QBrush to color plots according to the plotted value:
# Prepare demonstration data
raw = np.linspace(0.0, 2.0, 400)
y_data1 = ( (raw+0.1)%1 ) ** 4
y_data2 = ( (raw+0.1)%1 ) ** 4 - ( (raw+0.6)%1 ) ** 4

# Example 1: Gradient pen
cm = pg.colormap.get('CET-L17') # prepare a linear color map
cm.reverse()                    # reverse it to put light colors at the top
pen = cm.getPen( span=(0.0,1.0), width=5 ) # gradient from blue (y=0) to white (y=1)
# plot a curve drawn with a pen colored according to y value:
curve1 = pg.PlotDataItem( y=y_data1, pen=pen )

# Example 2: Gradient brush
cm = pg.colormap.get('CET-D1') # prepare a diverging color map
cm.setMappingMode('diverging') # set mapping mode
brush = cm.getBrush( span=(-1., 1.) ) # gradient from blue at -1 to red at +1
# plot a curve that is filled to zero with the gradient brush:
curve2 = pg.PlotDataItem( y=y_data2, pen='w', brush=brush, fillLevel=0.0 )
The use of color maps is also demonstrated in the ImageView, Color Gradient Plots and ColorBarItem Examples.
API Reference
-
pyqtgraph.colormap.listMaps(source=None)[source]¶ Warning
Experimental, subject to change.
List available color maps.
- Parameters
source (str, optional) –
Color map source. If omitted, locally stored maps are listed. Otherwise
’matplotlib’ lists maps that can be imported from Matplotlib
’colorcet’ lists maps that can be imported from ColorCET
- Returns
Known color map names.
- Return type
list of str
-
pyqtgraph.colormap.get(name, source=None, skipCache=False)[source]¶ Warning
Experimental, subject to change.
Returns a ColorMap object from a local definition or imported from another library. The generated ColorMap objects are cached for fast repeated access.
- Parameters
name (str) – Name of color map. In addition to the included maps, this can also be a path to a file in the local folder. See the files in the
pyqtgraph/colors/maps/folder for examples of the format.source (str, optional) –
If omitted, a locally stored map is returned. Otherwise
’matplotlib’ imports a map defined by Matplotlib.
’colorcet’ imports a map defined by ColorCET.
skipCache (bool, optional) – If skipCache=True, the internal cache is skipped and a new ColorMap object is generated. This can load an unaltered copy when the previous ColorMap object has been modified.
-
pyqtgraph.colormap.getFromMatplotlib(name)[source]¶ Generates a ColorMap object from a Matplotlib definition. Same as
colormap.get(name, source='matplotlib').
-
pyqtgraph.colormap.getFromColorcet(name)[source]¶ Generates a ColorMap object from a colorcet definition. Same as
colormap.get(name, source='colorcet').
-
pyqtgraph.colormap.modulatedBarData(length=768, width=32)[source]¶ Returns an NumPy array that represents a modulated color bar ranging from 0 to 1. This is used to judge the perceived variation of the color gradient.
- Parameters
length (int) – Length of the data set. Values will vary from 0 to 1 over this axis.
width (int) – Width of the data set. The modulation will vary from 0% to 4% over this axis.
-
class
pyqtgraph.ColorMap(pos, color, mapping=ColorMap.CLIP)[source]¶ ColorMap stores a mapping of specific data values to colors, for example:
0.0 → black0.2 → red0.6 → yellow1.0 → whiteThe colors for intermediate values are determined by interpolating between the two nearest colors in RGB color space.
A ColorMap object provides access to the interpolated colors by indexing with a float value:
cm[0.5]returns a QColor corresponding to the center of ColorMap cm.-
__init__(pos, color, mapping=ColorMap.CLIP)[source]¶ - Parameters
pos (array_like of float in range 0 to 1, or None) – Assigned positions of specified colors. None sets equal spacing.
color (array_like of colors) – List of colors, interpreted via
mkColor().mapping (str or int, optional) –
Controls how values outside the 0 to 1 range are mapped to colors. See
setMappingMode()for details.The default of ColorMap.CLIP continues to show the colors assigned to 0 and 1 for all values below or above this range, respectively.
-
getBrush(span=(0.0, 1.0), orientation='vertical')[source]¶ Returns a QBrush painting with the color map applied over the selected span of plot values. When the mapping mode is set to ColorMap.MIRROR, the selected span includes the color map twice, first in reversed order and then normal.
- Parameters
span (tuple (min, max), default (0.0, 1.0)) –
Span of data values covered by the gradient:
Color map value 0.0 will appear at min,
Color map value 1.0 will appear at max.
orientation (str, default 'vertical') –
Orientiation of the gradient:
’vertical’: span corresponds to the y coordinate.
’horizontal’: span corresponds to the x coordinate.
-
getColors(mode=1)[source]¶ Returns a list of the colors associated with the stops of the color map.
- The parameter mode can be one of
ColorMap.BYTE or ‘byte’ to return colors as RGBA tuples in byte format (0 to 255)
ColorMap.FLOAT or ‘float’ to return colors as RGBA tuples in float format (0.0 to 1.0)
ColorMap.QCOLOR or ‘qcolor’ to return a list of QColors
The default is byte format.
-
getGradient(p1=None, p2=None)[source]¶ Returns a QtGui.QLinearGradient corresponding to this ColorMap. The span and orientiation is given by two points in plot coordinates.
When no parameters are given for p1 and p2, the gradient is mapped to the y coordinates 0 to 1, unless the color map is defined for a more limited range.
- Parameters
p1 (QtCore.QPointF, default (0,0)) – Starting point (value 0) of the gradient.
p2 (QtCore.QPointF, default (dy,0)) – End point (value 1) of the gradient. Default parameter dy is the span of
max(pos) - min(pos)over which the color map is defined, typically dy=1.
-
getLookupTable(start=0.0, stop=1.0, nPts=512, alpha=None, mode=ColorMap.BYTE)[source]¶ Returns an equally-spaced lookup table of RGB(A) values created by interpolating the specified color stops.
- Parameters
start (float, default=0.0) – The starting value in the lookup table
stop (float, default=1.0) – The final value in the lookup table
nPts (int, default is 512) – The number of points in the returned lookup table.
alpha (True, False, or None) – Specifies whether or not alpha values are included in the table. If alpha is None, it will be automatically determined.
mode (int or str, default is ColorMap.BYTE) – Determines return type as described in
map(), can be either ColorMap.BYTE (0 to 255), ColorMap.FLOAT (0.0 to 1.0) or ColorMap.QColor.
- Returns
array of color.dtype – for ColorMap.BYTE or ColorMap.FLOAT:
RGB values for each data value, arranged in the same shape as data. If alpha values are included the array has shape (nPts, 4), otherwise (nPts, 3).
list of QColor objects – for ColorMap.QCOLOR:
Colors for each data value as QColor objects.
-
getPen(span=(0.0, 1.0), orientation='vertical', width=1.0)[source]¶ Returns a QPen that draws according to the color map based on vertical or horizontal position.
- Parameters
span (tuple (min, max), default (0.0, 1.0)) –
Span of the data values covered by the gradient:
Color map value 0.0 will appear at min.
Color map value 1.0 will appear at max.
orientation (str, default 'vertical') –
Orientiation of the gradient:
’vertical’ creates a vertical gradient, where span corresponds to the y coordinate.
’horizontal’ creates a horizontal gradient, where span correspnds to the x coordinate.
width (int or float) – Width of the pen in pixels on screen.
-
getStops(mode=1)[source]¶ Returns a tuple (stops, colors) containing a list of all stops (ranging 0.0 to 1.0) and a list of the associated colors.
- The parameter mode can be one of
ColorMap.BYTE or ‘byte’ to return colors as RGBA tuples in byte format (0 to 255)
ColorMap.FLOAT or ‘float’ to return colors as RGBA tuples in float format (0.0 to 1.0)
ColorMap.QCOLOR or ‘qcolor’ to return a list of QColors
The default is byte format.
-
isMapTrivial()[source]¶ Returns True if the gradient has exactly two stops in it: Black at 0.0 and white at 1.0.
-
linearize()[source]¶ Adjusts the positions assigned to color stops to approximately equalize the perceived color difference for a fixed step.
-
map(data, mode=ColorMap.BYTE)[source]¶ Returns an array of colors corresponding to a single value or an array of values. Data must be either a scalar position or an array (any shape) of positions.
- Parameters
data (float or array_like of float) – Scalar value(s) to be mapped to colors
mode (str or int, optional) –
Determines return format:
ColorMap.BYTE or ‘byte’: Colors are returned as 0-255 unsigned bytes. (default)
ColorMap.FLOAT or ‘float’: Colors are returned as 0.0-1.0 floats.
ColorMap.QCOLOR or ‘qcolor’: Colors are returned as QColor objects.
- Returns
array of color.dtype – for ColorMap.BYTE or ColorMap.FLOAT:
RGB values for each data value, arranged in the same shape as data.
list of QColor objects – for ColorMap.QCOLOR:
Colors for each data value as Qcolor objects.
-
reverse()[source]¶ Reverses the color map, so that the color assigned to a value of 1 now appears at 0 and vice versa. This is convenient to adjust imported color maps.
-
setMappingMode(mapping)[source]¶ Sets the way that values outside of the range 0 to 1 are mapped to colors.
- Parameters
mapping (int or str) –
Sets mapping mode to
ColorMap.CLIP or ‘clip’: Values are clipped to the range 0 to 1. ColorMap defaults to this.
ColorMap.REPEAT or ‘repeat’: Colors repeat cyclically, i.e. range 1 to 2 repeats the colors for 0 to 1.
ColorMap.MIRROR or ‘mirror’: The range 0 to -1 uses same colors (in reverse order) as 0 to 1.
ColorMap.DIVERGING or ‘diverging’: Colors are mapped to -1 to 1 such that the central value appears at 0.
-